Super cool talk and demo at @helsinkijs by @the_rootcause. These guys will save you hours of debugging!!
— Gonçalo Pestana (@gpestana) March 9, 2017
Find JavaScript bugs faster
Record videos of user sessions to easily reproduce JavaScript errors without having to ask end user for details. Try a demo in our online sandbox.
THE COMPLETE ERROR MONITORING SOLUTION FOR MODERN WEB APPS
How it works:
ADD OUR SCRIPT TO YOUR WEB PAGES
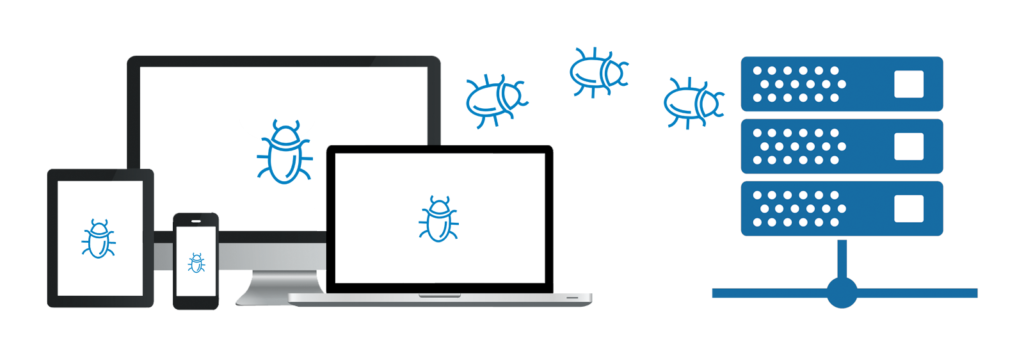
Include a small script on your page which installs a “catch-all” exception handler. The script also records all user interaction, ajax requests, console logs and other interesting data.
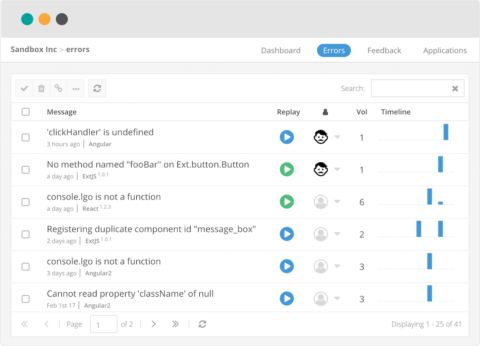
GET NOTIFIED
When an unhandled exception happens, an error report is created and sent to the server using a secure HTTPS channel. We’ll notify you via email or Slack, don’t worry. You decide if and when you are notified, with intervals ranging from once per minute up to once per week.
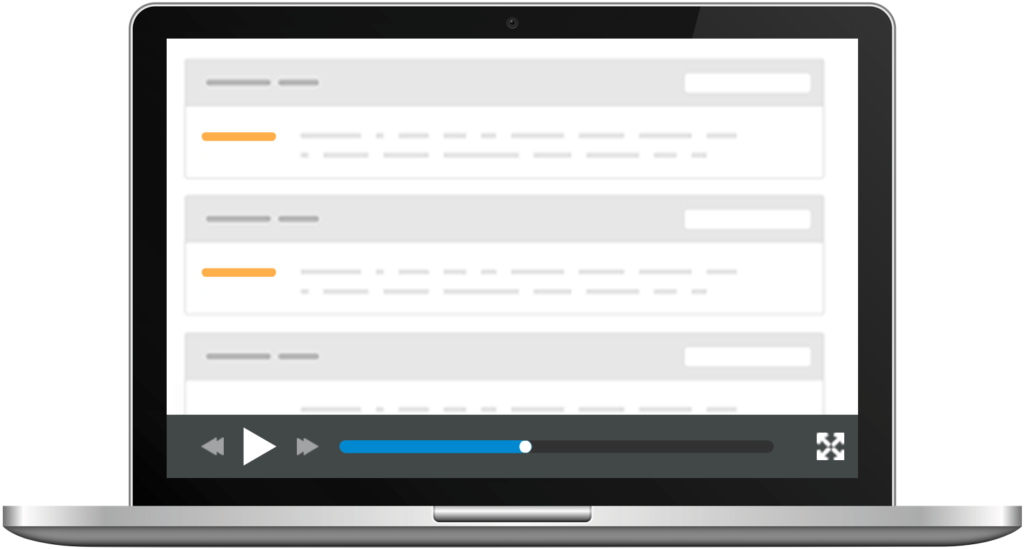
REPLAY THE USER SESSION
There is no faster way to debug an error, than to have it reproduced live in your browser. With our session replay feature, you simply click play and have a cup of coffee while the exception is being reproduced in your browser. No need to ask the end-user what he or she did. We also support video replay of the session.
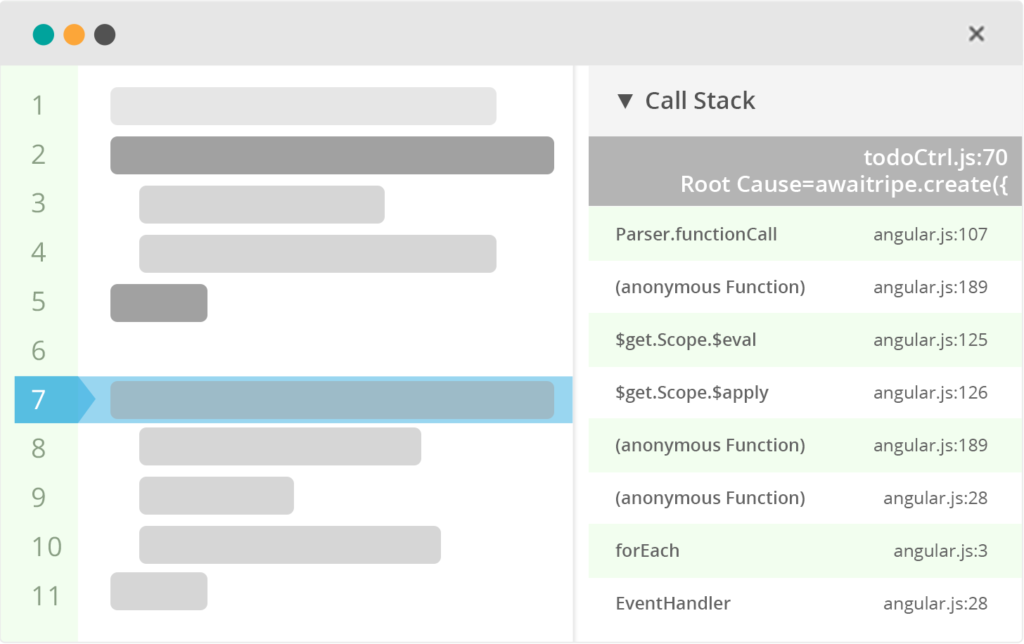
DEBUG WITH A BREAKPOINT
After replaying a session the error will be triggered and you will have an active breakpoint, just as if you manually performed all the steps yourself. Debugging doesn’t get easier than when you have error reproduced live in your browser.

SAVE TIME AND MONEY
You will save tons of time since you no longer have to manually communicate with end users or QA to learn how they triggered that bug. You can now reproduce a bug in minutes and fixing bugs will actually be fun (trust us).
Ready to try a new debugging experience?
Get started for free Mats' #senchacon presentation on @bryntum error logging is impressive as hell and well timed for us.
— Disnebraska (@hobaird) November 9, 2016